eBPF profiling is revolutionizing the way developers understand and optimize their code, offering unprecedented insights into application performance. This blog post explores the power of eBPF profiling and its impact on developer observability.
The extended Berkeley packet filter (eBPF) is a powerful tool for continuous performance profiling and monitoring of complex systems, providing valuable metrics and insights for performance engineers and enabling early issue detection and resolution in a DevOps culture.
Show Notes
GUEST: Frederic Branczyk, CEO Polar Signals
LINKEDIN PROFILE: https://www.linkedin.com/in/frederic-branczyk/
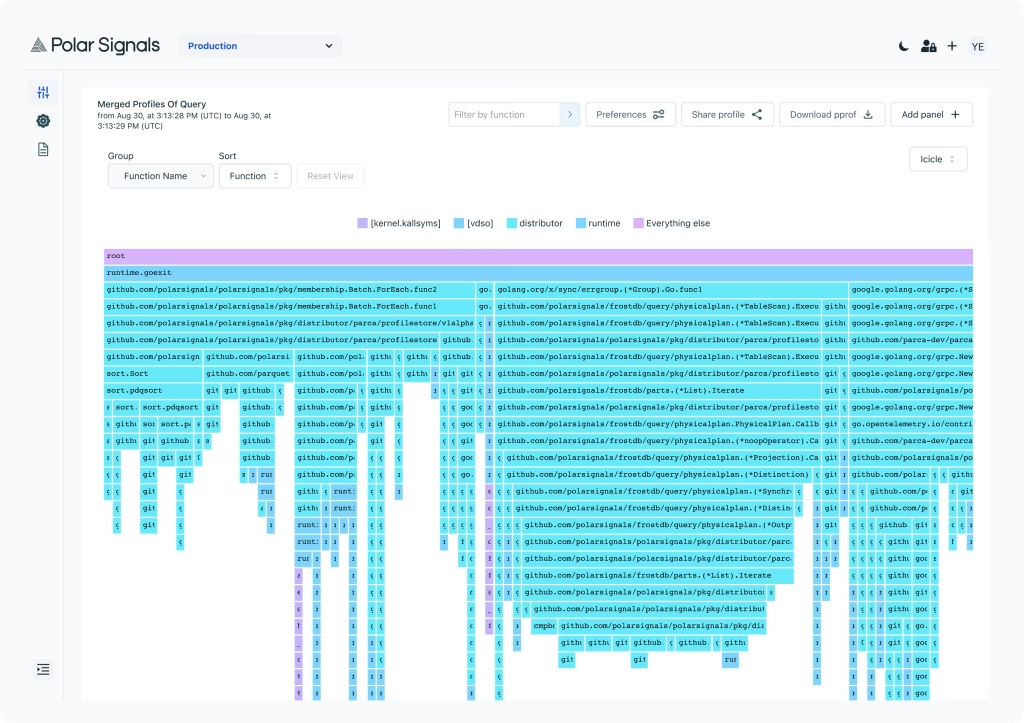
Polar Signals Cloud is an always-on, zero-instrumentation continuous profiling product that points you to where in your code CPU time is spent, and helps you maintain an efficient system in the long run. The product is based on the open-source Parca project and is now generally available!
https://www.parca.dev/docs/overview/
Key Video Insights for eBPF Profiling
🚀 Frederick Branczyk discusses the benefits of using eBPF for isolating and fixing poor performing code, highlighting its potential for improving performance engineering.
🔄 eBPF is uniquely positioned to capture profiling data, making it a valuable addition to tools like Prometheus for performance analysis and optimization.
📊 eBPF allows us to capture stack traces and build statistics in real-time, providing valuable insights into the execution of programs.
💡 eBPF provides a flexible framework for instrumentation, allowing developers to create custom hooks and perform a wide range of tasks, similar to traditional instrumentation methods.
💡 eBPF allows developers to measure various aspects of their code, such as RPC calls and memory allocations, providing flexibility in performance profiling.
💡 eBPF enables observability without instrumentation, automatically capturing latency from specific network packets, such as MySQL queries, offering a new approach to performance profiling.
🤔 The use of eBPF as a technology for building a profiler allows for selective data collection, ensuring that only the necessary data is gathered, reducing unnecessary overhead.
🗣️ Customers have expressed that eBPF is the only way to achieve continuous profiling, highlighting its importance and effectiveness.
Traditional Profiling vs. eBPF Profiling
Traditionally, profiling has been a valuable tool for identifying performance bottlenecks in software. However, traditional profilers often suffer from high overhead, making them unsuitable for continuous use in production environments. eBPF profiling, leveraging the power of the extended Berkeley Packet Filter (eBPF), offers a groundbreaking alternative, enabling continuous profiling with minimal overhead.
eBPF acts as a virtual machine residing within the Linux kernel. This unique positioning allows eBPF programs to hook into various kernel functions and events, capturing performance data in real-time with remarkable efficiency.
Unlike traditional profilers that capture a vast amount of data, eBPF profilers are highly selective, gathering only the essential data needed for analysis. This targeted approach significantly reduces overhead, making continuous profiling feasible even in production settings.
Benefits of eBPF Profiling
Continuous eBPF profiling unlocks numerous advantages for developers and performance engineers:
- Pinpoint Performance Bottlenecks: Identify specific lines of code consuming excessive CPU cycles or memory, enabling targeted optimization efforts.
- Optimize Cloud Costs: Understand the resource utilization of different code segments, allowing for efficient resource allocation and cost reduction in cloud environments.
- Proactive Performance Management: Monitor performance continuously throughout the development lifecycle, enabling early detection and resolution of performance issues.
- Enhanced Visibility into Third-Party Components: Gain insights into the performance of external libraries and components, even those without built-in instrumentation.
Developer Observability: A New Paradigm
The emergence of “developer observability” is a key benefit of eBPF profiling. This new paradigm empowers developers with detailed performance data, fostering a deeper understanding of their code’s behavior in real-world scenarios.
eBPF profiling bridges the gap between traditional infrastructure monitoring and application-level insights, enabling developers to:
- Make data-driven decisions during development: Observe the performance impact of new features and code changes in real-time, facilitating informed design choices.
- Proactively address performance concerns: Identify and resolve performance bottlenecks early in the development cycle, preventing costly production issues.
- Continuously optimize application performance: Gain ongoing visibility into code behavior, allowing for iterative performance improvements throughout the application lifecycle.
Open-Source Solutions for eBPF Profiling
Several open-source eBPF profilers provide comprehensive solutions for continuous profiling. These typically consist of two main components:
- The Profiler: An eBPF-based profiler that captures stack traces and generates performance profiles with minimal overhead.
- The Server: A centralized system for storing, analyzing, and visualizing profiling data, providing a user-friendly interface for developers.
Some companies also offer cloud-based platforms designed to handle large-scale deployments of eBPF profiling solutions.
Conclusion
eBPF profiling represents a significant advancement in developer observability, empowering teams to build and maintain high-performance applications. By leveraging the capabilities of eBPF, developers can gain unprecedented insights into their code’s behavior, proactively address performance issues, and optimize their applications for optimal efficiency.
If you’re looking to take your performance engineering to the next level, exploring eBPF profiling is essential. The insights gained from continuous profiling can lead to significant cost savings, improved application performance, and a deeper understanding of your codebase.
Check out this other SMC Journal podcast episode about eBPF.
🔥 Like and Subscribe 🔥
Connect with me 👋
TWITTER ► https://bit.ly/3HmWF8d
LINKEDIN COMPANY ► https://bit.ly/3kICS9g
LINKEDIN PROFILE ► https://bit.ly/30Eshp7
Want to support the show? Buy Me A Coffee! https://bit.ly/3NadcPK
🔗 Links:
- Scott Moore Consulting: https://scottmoore.consulting
- The Performance Tour: https://theperformancetour.com
- SMC Journal: https://smcjournal.com
- DevOps Driving: https://devopsdriving.com
- Security Champions https://thesecuritychampions.com
- DevPerfOps: https://devperfops.org
- PerfCruise: https://perfcruise.com